

There is a trading approach generating significant buzz across YouTube and options forums: buying a long straddle a few weeks before a company reports quarterly earnings, letting the pre-announcement surge in implied volatility (IV) lift option prices, and selling right before the announcement to avoid the post-earnings collapse.
Recently, my friend and fellow options trader Karl Domm broke down this system in his video, “I Studied 687 Option Strategies. Here's What Actually Works.”
In the video, Karl shares an impressive live equity curve: starting with $6,053 on January 1, 2025, and compounding it to $38,462 by July 2026; a 6.3X return (+535%) in roughly 18 months without adding outside capital.
Karl calls this framework the Earnings Edge and describes it as "direction-free option buying."
Karl is a friend, and he is one of the few educators in the trading space who provides genuine brokerage tracking and honest critique.
In my opinion, if you're seeking a trustworthy mentor who cares about the truth and doing the right thing, there is no one better than Karl Domm.
Even so, and hopefully Karl will agree, I feel it's important to be slightly skeptical of enormous gains because, usually, they're accomplished by using massive amounts of leverage.
This article will attempt to apply an objective, mathematical translation of what the strategy actually is, why the trade works, and what the same numbers produce when applied to an account using "normal" leverage.
Quick Verdict
- The underlying trade mechanism is real: Implied volatility (IV) systematically expands in the weeks leading into earnings. Karl's core rule—exiting before the announcement to avoid IV crush—is completely supported by empirical derivatives research.
- The 6X headline return seems to come from position concentration, not an infinite edge: An average win of $1,234 on a $6,053 starting account requires risking approximately 68% of total account equity on opening trades.
- What realistic accounts should expect: When executed with standard risk management (risking 1% to 2% of equity per trade to avoid account ruin), the exact same win rate and payoff ratio yield an expected return of roughly 5% to 12% annually (which is still great if you deploy this strategy around earnings time and combine it with other strategies)!
If you want to see the exact blueprint I used to generate this $120k day, I put together a free video course walking through the strategy step-by-step. You can grab it below:
Real E*TRADE Single-Session Performance 
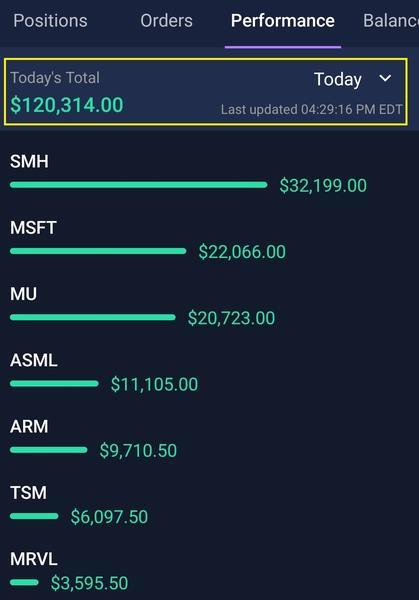
Real, verified E*TRADE account screenshot.
Free $400+ Options Course
The Systematic Strategy That Lets You "Be the House"
Join 3,500+ members learning a disciplined mathematical edge from a former Wall Street banker
- ✓ Get instant access to the $400+ options course — free
- ✓ Built for bull, bear, and flat market conditions
- ✓ Maximize returns while minimizing risk
BestStockStrategy.com · 2 Gold Street, New York, NY 10038 · Options trading involves risk of loss. Past performance does not guarantee future results.
What Karl Domm Gets 100% Right
Before examining the position sizing math, it is important to give credit where Karl’s analysis is accurate and insightful:
1. The Myth of "Delta Neutrality" in Premium Selling
In his video, Karl illustrates why traditional premium sellers get blindsided by directional moves.
Even if a trade starts delta-neutral, a mere 1% move in the underlying asset quickly overwhelms daily theta collection:
- Put Credit Spreads (SPX): Seeking $3.69/day in theta can lose $128 on a 1% move—direction overwhelms the edge by 34 times.
- Iron Condors (SPY): Seeking $9.73 to $11/day in theta can lose $125 on a 1% move—direction overwhelms the edge by 12 times.
- The Wheel Strategy (SPY): Seeking $11.19/day in theta can lose $216 on a 1% move—direction overwhelms the edge by 19 times.
- Poor Man’s Covered Calls (SPY): Seeking $5.61/day in theta can lose $367 on a 1% move—direction overwhelms the edge by 65 times.
Karl’s point is rock-solid: delta neutrality is temporary, and gamma risk is real.
2. The Danger of Negative Vega and Bid-Ask Blowouts
Karl highlights a case study of a popular YouTube trader who held typical premium-selling positions (short strangles, 112s, call spreads) heading into August 2024.
Between July 31, 2024, and August 5, 2024, that trader’s account dropped from $530,000 to under $279,000 in three trading days—a −47% drawdown ($251,000 loss).
By June 2026 (nearly two years later), the account was still sitting at ~$503,000, struggling to make the +88% return required to get back to even.
Side-note: I have had followers of that YouTuber trader email me to say that they were forced into liquidation, lost ~70% of their account value and still haven't recovered.
Karl correctly explains the twin culprits:
- Negative Vega: When the VIX exploded, short options skyrocketed in value against the seller.
- Liquidity Evaporation: Normal 30-day 16-delta bid-ask spreads of $0.30 ($24.40 vs $24.70) blew out to massive spreads ($55.80 vs $134.40), forcing retail traders into catastrophic fills.
This is why I advocate on BestStockStrategy for implementing hedges that reduce tail risk. Personally, I prefer to trade with positive delta, positive theta and positive vega, since being negative vega while being short a lot of puts can lead to margin calls - you can receive valuable free training below.
What the "Earnings Edge" Trade Likely Is
Karl describes his strategy as "buying options at a discount" and "direction-free option buying."
While I'm NOT privy to the exact rules Karl deploys, it's my opinion that it's something similar to this:
The 3-Step Pre-Earnings Straddle Framework
- Phase 1 — Early Entry (2 to 4 Weeks Out): Buy an at-the-money (ATM) long call and an ATM long put (a straddle). Because you own both sides, you don't need to predict which way the stock will break.
- Phase 2 — The IV Ramp: As earnings approach, uncertainty and trading demand build up (what Karl compares to surge pricing on holiday airline tickets). Implied volatility expands, lifting the market value of your options (positive Vega).
- Phase 3 — The Hard Exit (Pre-Announcement): Sell both legs 1 to 2 days before the company releases earnings. This locks in the volatility gain and completely avoids post-earnings IV crush.
Karl shared an example of placing this trade on TSM (Taiwan Semiconductor) before earnings, closing it a few days later for a +78% gain on margin/debit without predicting stock direction.
Why You Must Exit Before the Print
To prove why buying options at normal "retail prices" fails, Karl cited an ADT trade from January 2021 where he bought stock and a long call simultaneously. When closed 14 days later at the exact same stock price, the stock broke even while the call option lost 33% (−$275) due to theta decay.
Holding a straddle through earnings exposes you to brutal IV crush. Studies across over 1,000 earnings events show that holding through the print yields an average win rate of only ~20% with average losses of −25%. Exiting before the announcement is the single most critical rule of the strategy.
Where the 6X Headline Return Really Comes From
Karl published his live performance log from January 1, 2025 to July 26, 2026:
- Total Trades: 44
- Performance: 33 Wins, 7 Losses, 4 Breakevens (82.5% Win Rate)
- Average Win: $1,234
- Average Loss: $811
- Starting Capital: $6,053
- Ending Capital: $38,462 (+$32,409 Net Profit)
The arithmetic is internally consistent:
- Total Gains from Wins: 33 Wins × $1,234 = $40,722
- Total Losses: 7 Losses × $811 = $5,677
- Net Performance: $40,722 − $5,677 = $35,045
After subtracting trading commissions, bid-ask friction, and breakeven trades, this closely matches his reported +$32,409 net gain.
Deconstructing the Position Sizing Math
The secret to the 6X return is not an infinite mathematical edge; rather it seems that it's extreme position concentration on a small starting balance (which, in my opinion, is fine as long as it's being used as a small part of your overall portfolio):
- An average win of $1,234 on a $6,053 starting account means each winning trade increased the entire account balance by +20.3%.
- On a pre-earnings straddle, capturing an IV ramp typically yields a gain of approximately +30% on the debit paid.
- To generate a $1,234 gain from a +30% move, the opening trade size had to be approximately $4,113.
- $4,113 is 68% of the entire $6,053 starting account placed into a single trade.
The loss data confirms this math: a −20% stop loss on a $4,100 position produces an $820 loss—virtually identical to Karl's reported $811 average loss.
The Mathematical Reality of the 6X Return
- Starting Account Balance: $6,053
- Estimated Capital Deployed Per Trade: ~$4,100 (68% of total account equity)
- Average Win (+30% on position): +$1,234 (+20.3% total account growth)
- Average Loss (−20% on position): −$811 (−13.4% total account drawdown)
As the account compounded to $20,000 and $38,000, deploying $4,000 per trade reduced the position sizing down to ~11% of equity.
But in the crucial early phase, account sizing seems to have ranged between 15% and 68% of total equity per trade.
On a $6,000 account, taking aggressive swings is a personal choice.
But it is vital for traders to understand: the 6X return was likely produced by heavy leverage and position concentration during a favorable market sequence.
Strategy Return Comparison by Position Size
What happens when you apply these exact same metrics to different account sizes and risk profiles?
Metric | Earnings Edge (15%–68%) | "Normal" Retail (2%–5%) | Institutional (1%–2%) |
|---|---|---|---|
Typical Capital Deployed | ~$4,100 (up to 68% of starting equity) | $2,000–$5,000 on a $100K account | $1,000–$2,000 on a $100K account |
Win Rate | 82.5% | 82.5% | 82.5% |
Average Win / Loss | +30% Win / −20% Loss | +30% Win / −20% Loss | +30% Win / −20% Loss |
Trade Frequency |
~29 trades/year |
~29 trades/year |
~29 trades/year |
Est. Annual Return |
+150% to +400% (or bust) |
+12% to +25% |
+5% to +12% |
Max Drawdown Risk |
High (50%+ or Total Wipeout) |
Moderate (10%–18%) |
Low (3%–6%) |
Risk of Ruin |
High (Vulnerable to bad runs) |
Low |
Near Zero |
Interactive Position-Sizing Translator
Use the interactive calculator below to test different account balances and position sizes using Karl's published win rate and trade frequencies:
Position-Sizing Translator
Same win rate, same win/loss sizes — different position size. See what the strategy produces for you.
Illustrative only. Assumes +30% on winners and −20% on losers of the amount deployed, no compounding within the year, and excludes commissions, slippage and taxes. Past performance does not guarantee future results.
The Sample Size Problem and the Kelly Criterion
Forty-four trades over 18 months represent a solid start, but in statistical derivatives research, 44 trades cannot establish an 82% win rate with high confidence. The true long-term win rate could easily normalize between 60% and 70%.
This is where the Kelly Criterion (the mathematical formula for optimal position sizing) becomes critical:
- If your true win rate is 82% with a +30%/−20% payoff, risking 25%–35% of your account is aggressive but mathematically defensible.
- If the true win rate is 65%, risking 25%+ of your equity represents severe over-betting.
Under the Kelly formula, over-betting relative to your true edge mathematically guarantees long-term portfolio depletion, even if the underlying trading edge is positive.
What Academic Research Reveals About Entry Timing (A Better Way & Improved Trade?)
When is the best time to enter a pre-earnings straddle? While educational videos often suggest entering 2 to 4 weeks early, academic data points to a much narrower window:
- Khan & Khan (17-Year Study across 13,120 S&P 500 Straddles): Found that positions opened 30 trading days before earnings systematically lost money because daily theta decay outpaced IV expansion.
- Tastytrade Study (5-Day Pre-Earnings Entry): Found an average return of −0.45% before slippage and commissions.
- Gao, Xing, and Zhang (Journal of Financial and Quantitative Analysis, 2018): Documented a genuine positive anomaly of +3.34% on ATM straddles, but only when entered 3 days before the announcement.
- Commercial Services: Quantitative advisory firms trading this strategy commercially since 2011 explicitly recommend entering 5 to 7 days out, warning that entering 14+ days early burns unnecessary theta.
The Optimal Entry Timeline
- 21 to 14 Days Before Earnings: High Drag Phase. Implied volatility is flat, while theta decay eats option premium daily.
- 7 to 3 Days Before Earnings: The Sweet Spot. Implied volatility expansion turns convex, rapidly outpacing daily theta decay.
- Earnings Release Date: The Danger Zone. Post-earnings IV crush causes long straddles to collapse by an average of −25%.
The IV ramp turns sharply convex only in the final 3 to 7 trading days; entering 3 to 4 weeks early forces you to pay daily theta decay while waiting for volatility to move.
The Hidden Cost: Friction and Bid-Ask Spreads
A long straddle requires crossing four separate bid-ask spreads per round trip:
- Buy Call + Buy Put (Opening)
- Sell Call + Sell Put (Closing)
Research by Muravyev and Pearson ("Options Trading Costs Are Lower than You Think") notes that even with patient limit-order execution, crossing four spreads on a multi-leg trade creates 1.5% to 2.5% in round-trip friction.
Against an academic gross edge of +3.34%, transaction friction reduces the net expected gain to roughly 1.0% to 1.5% per trade before factoring in taxes.
Additionally, academic studies show the pre-earnings anomaly is strongest in smaller, volatile stocks—where bid-ask spreads are widest. On heavily traded mega-caps (like Nvidia, Apple, or Microsoft), market makers price in earnings uncertainty weeks ahead, leaving little discounted premium for retail buyers to exploit.
What I Recommend: Defined-Risk Premium Selling
If you examine historical market data, the structural mathematical edge in options markets consistently favors option sellers:
- Implied volatility exceeds realized volatility roughly 75% to 80% of the time (the Volatility Risk Premium).
- Across 10 years of earnings data in mega-caps like Apple (AAPL), long straddles lost money on average, while risk-defined short volatility strategies generated consistent positive expected value.
However, as Karl correctly observed, selling naked options carries severe tail risk during sudden market crashes.
The professional solution is selling option premium with mandatory debit-spread hedging. This allows you to collect premium while keeping absolute maximum loss strictly capped.
Want to learn disciplined, hedged premium selling? Check out my free options trading training ($400+ value, 127+ five-star reviews), which outlines the risk-defined principles behind my verified +78% and +67% trailing returns.
Final Verdict on Karl Domm’s Earnings Edge
Karl Domm’s Earnings Edge strategy is a legitimate options trading system built on a real market phenomenon.
Karl deserves tremendous credit for his transparency, his disciplined rules, and his honest tracking of live brokerage capital.
If you choose to trade pre-earnings straddles, keep these key principles in mind:
- Understand the Sizing: The 6X return was likely powered by ~68% initial position sizing. It is leverage on a small account, not an infinite edge.
- Set Realistic Return Targets: At responsible sizing (1%–2% risk per trade), expect realistic returns of 5% to 12% annually.
- Tighten Your Entry Window: Consider entering 3 to 7 days before earnings rather than 2 to 4 weeks early to minimize theta decay.
- Always Exit Before the Announcement: Never hold long straddles through the earnings release.
When sized prudently, pre-earnings straddles can be a valuable, non-directional addition to an options trader's playbook.
To summarize: I believe that Karl's Earnings Edge should be used as ONE SMALL COMPONENT of a portfolio and combined with other strategies.
Frequently Asked Questions (FAQ)
Does Karl Domm's Earnings Edge strategy actually work?
Yes. The underlying mechanism is valid: implied volatility rises into earnings, lifting option values. Academic research shows an average gross gain of +3.34% on at-the-money straddles entered 3 days before earnings. However, after bid-ask spreads and prudent position sizing, net returns are modest.
How did Karl Domm turn $6,053 into $38,462?
Karl achieved a ~6.3X return by pairing an estimated 82% win rate across 44 trades with what appears to be aggressive position sizing (deploying an estimated ~68% of his account equity on initial trades).
When is the best time to enter a pre-earnings straddle?
Academic and industry studies indicate the optimal entry window is 3 to 7 trading days before earnings. Entering 2 to 4 weeks early often results in losses because theta (time decay) outpaces implied volatility expansion.
What is the biggest risk of "direction-free option buying"?
The primary risk is time decay (theta). If implied volatility fails to rise fast enough or the stock remains stagnant, both legs of the straddle will lose value each day.
What return should I expect on a normal account?
At standard position sizing (risking 1% to 2% of total equity per trade), the expected annual return is roughly 5% to 12% per year.